Surviving the Titanic
A look at who survived the Titanic.


Surviving the Titanic
A detailed look at who survived the Titanic.
The Titanic tragedy remains one of the most infamous ocean disasters of our time. While the story of the RMS Titanic is portrayed in many movies, television shows, books and other forms of popular media, one movie, James Cameron's blockbuster hit, Titanic, stands out above the rest to keep this incident in the collective consciousness.
Hollywood is granted wide latitude for artistic license, and James Cameron undoubtedly used artistic license to full effect with the movie Titanic that has an entertainment-focussed narrative woven around a historical event. While the movie accurately touches on some factual details, such as how the ship sank, the insufficient number of lifeboats, and even the inaccurate passenger list, it also features a lot of inaccuracies such as "the heart of the ocean" diamond and the love affair between two fictional characters.
For most of the movie's viewers, it's hard to tell what parts of the movie are portrayed accurately, and what isn't. This article will use real data on the RMS Titanic's passengers to determine how accurately some parts the movie were portrayed.
Background
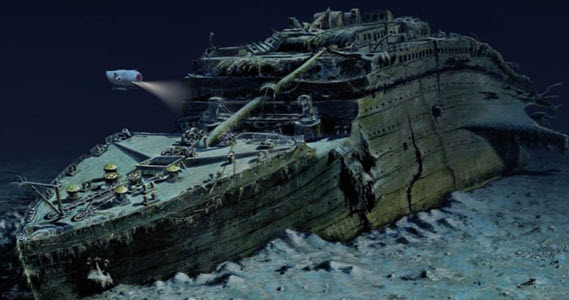
The RMS Titanic, a trans-oceanic passenger liner operated by the British White Star Line company, struck an iceberg on the vessel's maiden voyage which caused her to sink in the early morning hours of April 15, 1912.
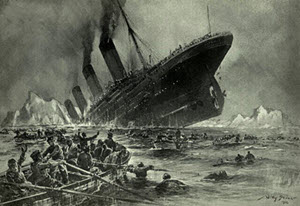
According to contemporary practices, the ship had only 20 lifeboats, 14 of which had a capacity of 65 people each, and the six others with capacities of between 40 and 47 people each. The RMS Titanic, therefore, had lifeboat coverage for between 1,150 and 1,192 of the estimated 2,200 passengers and crew on board.
Of the 2,200 passengers and crew estimated to be onboard the RMS Titanic, about 1,500 lost their lives as a result of the incident. It's important to note, however, that these are only estimates. Some passengers canceled their trip at the last minute which lead to confusion with the passenger list. Other passengers traveled under aliases and were subsequently double counted on the casualty list. Therefore, the exact totals for the number of souls on board, and the resulting deaths, remain elusive. These details were all touched on in one way or another in the movie.
Methods
Using a dataset available from Kaggle, which includes datapoints for 1,309 passengers who were aboard RMS Titanic, I looked for patterns in the data that could indicate the likelihood of passenger survival based upon specific features (Sex, Age and Passenger Class). Python, Pandas, NumPy, scikit-learn, matplotlib, and seaborn were used in a Jupyter Notebook to do all calculations, machine learning, and data visualizations.
The data from Kaggle came in two files. The first file had datapoints for 891 passengers and included the survival status for each passenger contained within. The second file had datapoints for an additional 418 passengers and this file lacked the survival statuses. For this second file, I built a supervised machine learning logistic regression model that was trained on the first file to predict the survival statuses of the passengers in the second file. The code for this model and the project as a whole, can be found in an exported Jupyter notebook by clicking here.
Additionally, there were a relatively small number of datapoints missing passenger ages. For these datapoints, the dataset's mean age was used.
The Data
The age distribution of the 1,309 passenger sample is mostly unimodal and slightly skewed-right with a large number of infants and small children. There are also a few outliers over the age of 70.

Figure 1 shows an average age of slightly over 29 and a median age of 28 for the sample.
Dividing the sample by sex shows that there were a lot more male passengers than female passengers.
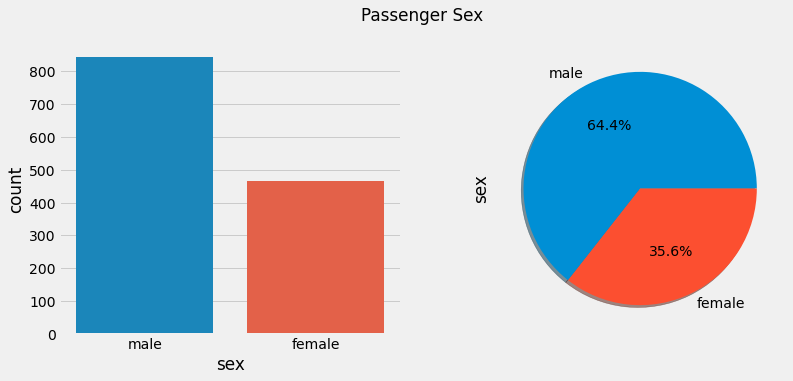
As shown in Figure 2, males make up over 64% of all passengers in our sample. As we'll see below, the age distributions are similar for both males and females, with only slight differences.
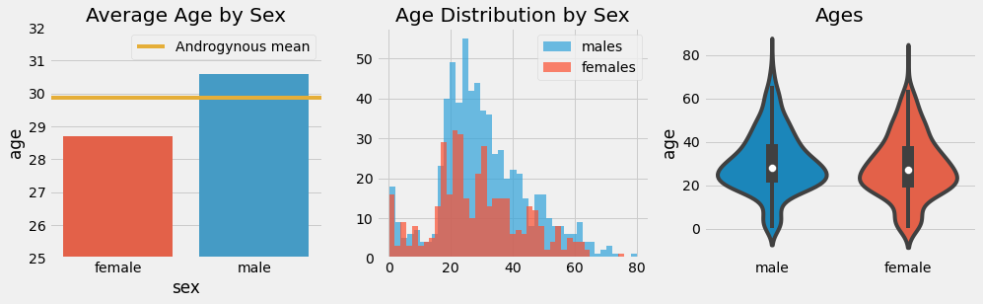
Figure 3 shows males having a slightly higher average age. For male passengers, the average age is around 30-years old, while it's just under 29-years old for female passengers. The distributions are similar, however.
Let's take a look at the three different classes; First Class, Second Class, and Third Class.
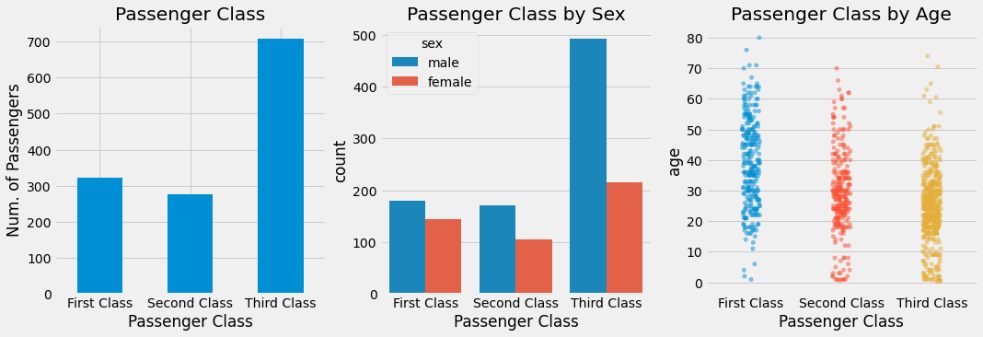
Figure 4 shows that Third Class had the most passengers. Second Class had the least passengers, which was only slightly less than First Class. Something else to note are the sexes and ages in each passenger class. We'll get to the ages soon, but first let's look at the sex makeup of the passenger classes in Figure 5 below.
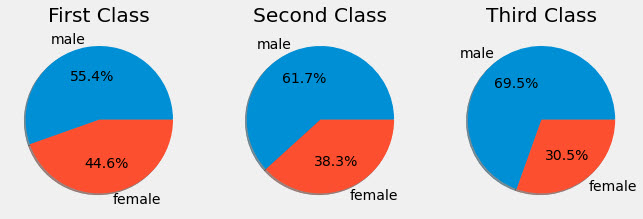
From Figure 5 we can see that Third Class had the highest proportion of males. Third Class was almost 70% male, compared to a little over half of First Class being male.
Next, we'll look at the age distributions for each passenger class.
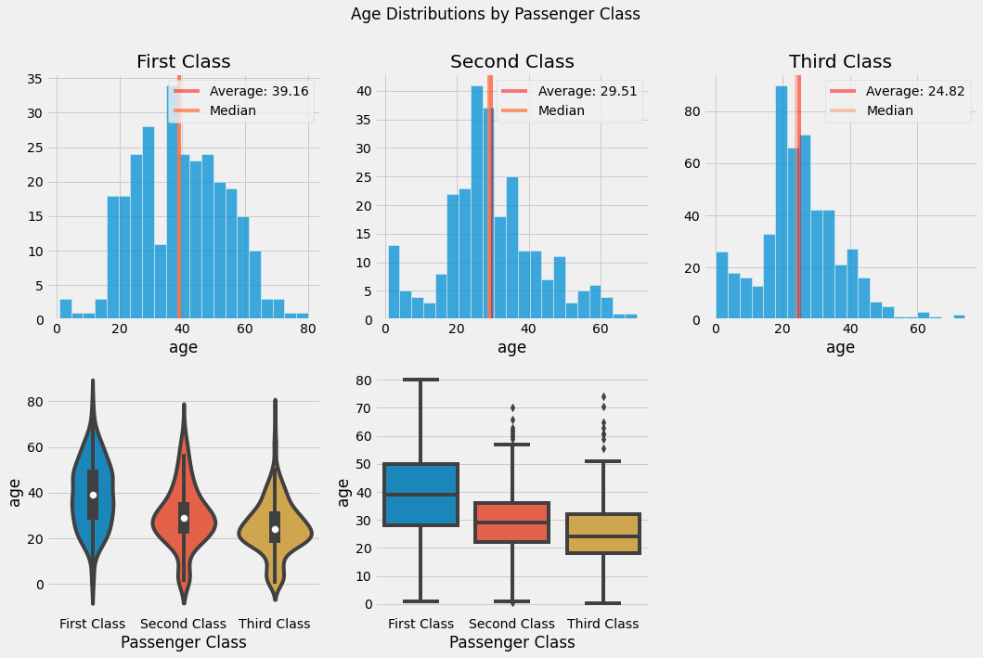
As we can see from Figure 5, the average age decreases as we go through the classes, from First Class through Third Class. First Class had an average age of about 39 years old, while Second Class had an average age of around 29 years old. The average age in Third Class was even younger at just under 25 years old. First Class also had fewer small children than the other two classes.
While there could be a lot of reasons for these age differences, it's likely due to older people having more wealth to travel in the more expensive passenger classes. Another contributing factor is that there are a lot of young men in Third Class, something that the movie Titanic seems to have portrayed accurately.
While we cannot say for sure why there were a lot of young men in Third Class or what their motivations for travelling were, the movie alludes to the idea that Third Class was full of young men seeking their fortunes in the New World, which makes sense.
Passenger Fate
Now that we know the sex, age, and passenger class makeup of the passengers aboard the RMS Titanic, let's dive into the fate of these passengers.
This article makes the assumption that only those passengers who were able to find a spot on a lifeboat survived. Due to the almost freezing waters of the North Atlantic where the RMS Titanic sank and the time it took for the first rescue vessel, RMS Carpathia, to arrive on the scene, any passenger in the water would have succumbed to hypothermia.
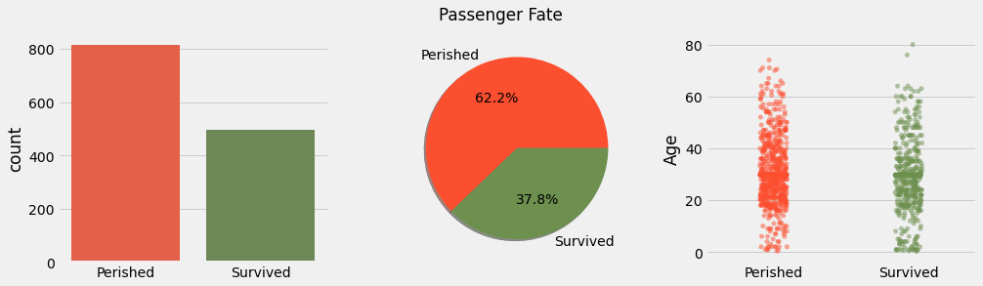
Figure 7 shows that only 37.8% of the passengers in our sample survived. Additionally, age doesn't seem to be a good indicator of a passenger's chance of survival, but this would need further investigation.
Next, we'll look at the survival rates of the passenger classes.
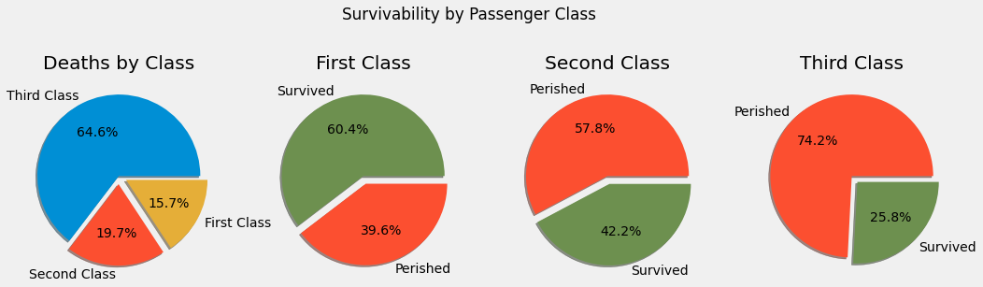
Figure 8 shows that First Class is the only passenger class where more people survived than perished. Third Class had the highest proportion of passengers perishing, with only about a quarter of passengers surviving. This seems to at least lend credence to the movie's portrayal of class preference for the evacuation, but let's reserve judgement for now.
Let's look at the survival rates by sex.
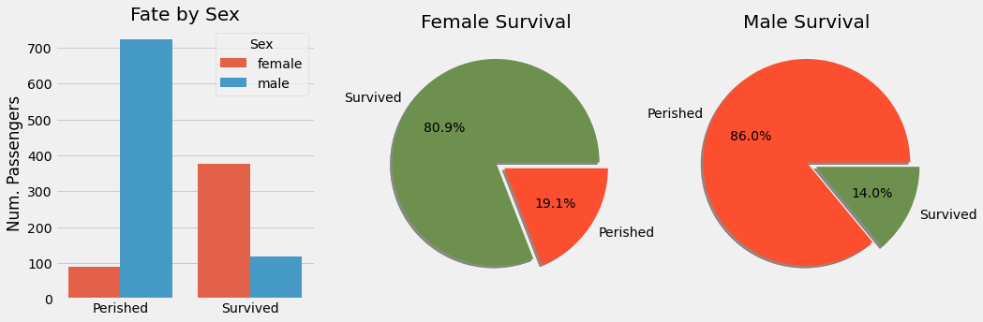
From Figure 9 we can see that more males perished in the incident than females. A lot more. The percentages of males who survived and perished are almost the inverse of the percentages of females who survived and perished. From our sample, just under 81% of female passengers survived, while 86% of male passengers perished.
The movie, Titanic, depicts a rigorous priority for seating women and children in the lifeboats first and so far the data suggests that this portrayal was indeed accurate.
Next, let's look at survival by sex and passenger class.
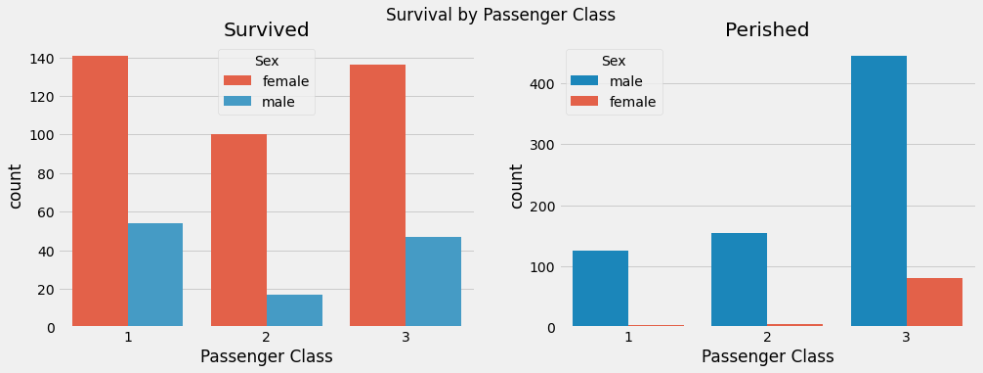
For Figure 10, it's important to note the difference in scale between Survived and Perished. Here we can see the relatively low rates of female passenger deaths, particularly for First and Second Classes. Additionally, we can see that a similar number of male passengers from First and Third Class survived.
If we looked at only the female passengers in Figure 10, it would seem to support the depiction in the movie that Third Class passengers were deliberately prevented from boarding the lifeboats. However, we can see that almost the same number of male passengers from First Class and Third Class were able to get on lifeboats.
Below, we'll look at these numbers in terms of percentages.
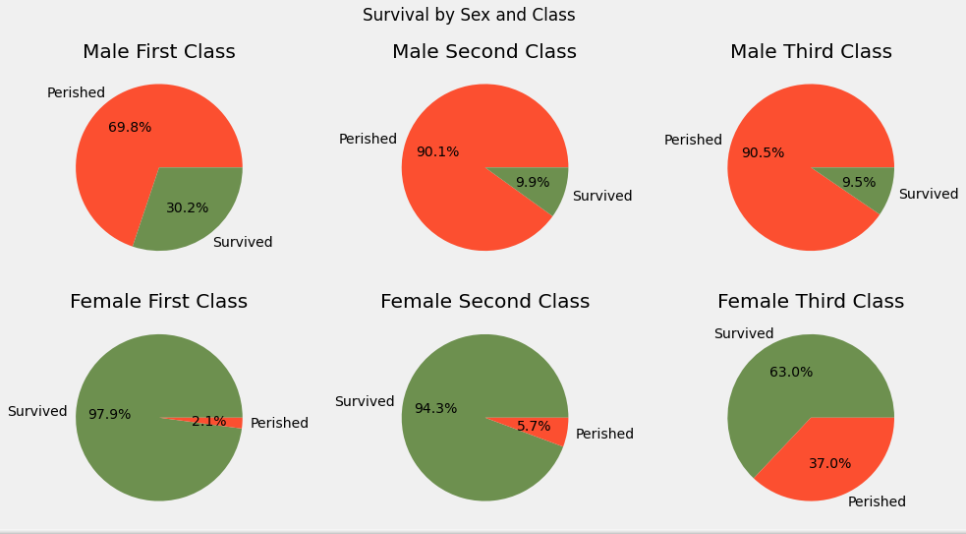
We get a bit more clarity from Figure 11, where we can see that despite a similar number of males surviving from First and Third Class (as shown in Fig. 10), First Class had the highest proportion of male survivors. Additionally and surprisingly, the proportion of males that survived from Third Class was almost identical to the proportion of males that survived from Second Class.
For females, 37% of Third Class female passengers perished, which was the largest proportion of female passengers who perished in the incident. First Class, on the other hand, had the highest proportion of female survivors. Likewise, First and Second Class female passengers fared relatively well with similar proportions of survivors.
Conclusion
While the movie, Titanic, used liberal amounts of artistic license to tell an entertaining and dramatic story about a historical event, the movie also managed to squeeze in a lot of factually accurate details. Some details depicted in the movie are supported by the data, while other details depicted in the movie are dispelled by the data.
First, the movie portrays Third Class as being full of young men, and this is supported by the data, as shown in Fig. 4 through Fig. 6.
Furthermore, the climax scene of the movie depicts a chaotic and poorly executed evacuation where there was a rigorous effort to seat only women and children on the lifeboats, with some lifeboats launched half-empty. This was likely an accurate portrayal that is supported by the data, given that almost 81% of female passengers survived while 86% of male passengers perished, as shown in Figure 9.
What the data doesn't support, however, is the movie's depiction of the crew locking Third Class passengers below deck, preventing them from reaching the lifeboats. This might seem plausible if we are looking at survival rates by passenger class only (fig. 8). However, by breaking the data down in multiple different ways, this scenario, as depicted in the movie, becomes less plausible due to the following insights:
- Second and Third Classes had the same proportion of male survivors. 10% of males from both Second and Third Class survived, as shown in Figure 11.
- Despite a much higher percentage of males from Third Class perishing, a similar number of males from First and Third Classes survived, and thus likely got seats on lifeboats, as shown in Figure 10.
- While Third Class represented the largest proportion of female passengers who perished, the majority of females from Third Class still survived, as shown in Figure 11.
It's much more likely that a higher proportion of passengers from First Class survived because they were closer to the upper decks where the lifeboats were located. Additionally, the news of the ship's doomed fate probably reached First Class passengers first, since they were closer to and more familiar with the ship's officers. This would have given them more time to prepare. On the other hand, Third Class passengers likely had lower survival rates because they were further away from the upper decks and news of the ships fate probably reached them too late to give them adequate time to secure a seat on one of the limited lifeboats.